


A social media KPI is not simply a number available in a dashboard. It is a measure chosen to answer a question and support a decision. Before collecting more data, identify what you need to understand: distribution, participation, useful visits or actions following those visits.
This 2027 edition uses sources checked on 20 November 2026. It predicts no future metric changes. Formulas and examples are working tools, not universal averages, ideal posting times or guaranteed results. Verify names, availability and definitions on each platform when reporting.
Start with a measurement agreement
For each objective, select one primary indicator and a few diagnostic measures. Record the intended decision, observed population, period, source and owner. “Increase relevant demonstration requests” needs request tracking and qualification; counting likes alone cannot answer that question.
Maintain a shared dictionary with exact metric name, formula, included actions, unit, time zone, organic or paid scope and extraction date. Mark missing information. Zero means a measurement produced no result; unavailable means something different. Otherwise a disconnected account may be mistaken for declining performance.
Understand eight indicators before comparing

1. Reach: a distinct audience within a scope
Reach describes distinct accounts or people exposed according to a network’s definition. Check estimation and period. Do not add individual post reach and call it a unique audience: the same person may appear repeatedly. Audiences also overlap across networks.
2. Impressions: displays rather than people
Impressions count eligible displays, including repetition. Within compatible scope, impressions divided by reach gives average exposure frequency. Higher frequency alone proves neither better recall nor relevance. Check definitions rather than automatically substituting views for impressions after an interface change.
3. Engagement rate: name your formula
An internal example is defined interactions ÷ reach × 100. Specify reactions, comments, shares, saves or clicks included. Follower- or impression-based formulas answer different questions. GA4 engagement rate concerns engaged sessions, not social interactions.
4. CTR: specify the click type
A possible link CTR is link clicks ÷ impressions × 100. Image, profile or interface clicks are not automatically destination visits. Do not call the numerator “people who clicked” when it includes repeat clicks. Keep absolute volumes alongside percentages.
5. Conversion rate: define action and population
You can measure sessions completing the action ÷ eligible sessions × 100 where instrumentation supports it. Define action, deduplication and scope. Multiple events divided by sessions creates a different ratio. A click-based conversion rate is possible but must be labelled and supported by compatible data.
6. Follower growth: net and contextual
Calculate (ending followers − starting followers) ÷ starting followers × 100. If the starting value is zero, report the absolute change instead of an undefined percentage. Growth may reflect a campaign, event or content unrelated to your activity; inspect audience relevance and unfollows too.
7. Top posts: rankings depend on objectives
A top post is a ranking, not one universal KPI. Rank by reach for distribution, clicks for traffic, or qualified requests where tracking permits. Retain format, topic and paid-support context. A high-volume post may have a lower rate without being useless.
8. Days and times: a testing dimension
Publication time helps examine differences; it does not establish a universal slot. Compare sufficiently similar content while considering format, topic, season and time zone. Repeat observations: one result cannot be attributed to timing alone.
Connect indicators to decisions

| Objective | Possible primary measure | Diagnostic information | Possible decision |
|---|---|---|---|
| Awareness | Reach in the selected scope | Repetition, audience, formats | Broaden or clarify a subject |
| Participation | Useful conversations | Defined interactions, questions | Prepare an explanation |
| Traffic | Measured relevant visits | Link CTR, destination consistency | Change the call to action |
| Conversion | Qualified requests or actions | Journey and case quality | Improve the form |
Add qualitative review of tone, objections and visual consistency. Define a sample and coding guide instead of relying on three memorable comments. Sentiment does not prove satisfaction or purchase intent. For conversations, combine measurement with moderation practices and open-case follow-up.
A numerical example: misleading averages
In this fictional example, both posts use the same interaction definition. Post A receives 20 interactions from reach of 200: 10%. Post B receives 80 interactions from reach of 4,000: 2%. Their simple average is 6%, giving two very different bases equal weight.
For an aggregate ratio of these observations, calculate (20 + 80) ÷ (200 + 4,000) × 100 = 2.38%. Label it interactions per summed post reach: the denominator is not a deduplicated unique audience. If interaction definitions differ, harmonise scope before producing this rate.
Separate video consumption from distribution
YouTube thumbnail impression documentation distinguishes these impressions from views and watch time. Keep exposure, starts and consumption separate. Record video duration, format and denominator before calculating completion for your comparisons.
Completion may help inspect storytelling, but a very short video is not automatically more useful than a longer explanation. Find where the audience encounters difficulty and propose a concrete revision. Data helps frame the question; it does not independently reveal viewers’ intentions.
Connect clicks, visits and attribution cautiously
Use stable campaign naming and test destinations. Network clicks and site sessions can differ because of interrupted loading, consent, devices and counting methods. Do not edit values simply to make them agree. Document the gap and check implementation with measurement owners.
Google Analytics describes attribution as assigning credit. It does not establish causality alone. Fix model, window, events and limits before reporting attributed revenue. ROAS is attributed revenue divided by ad expenditure. ROI needs an explicit profit-and-cost convention without counting the same expense twice.
Build a small, verifiable, useful dashboard
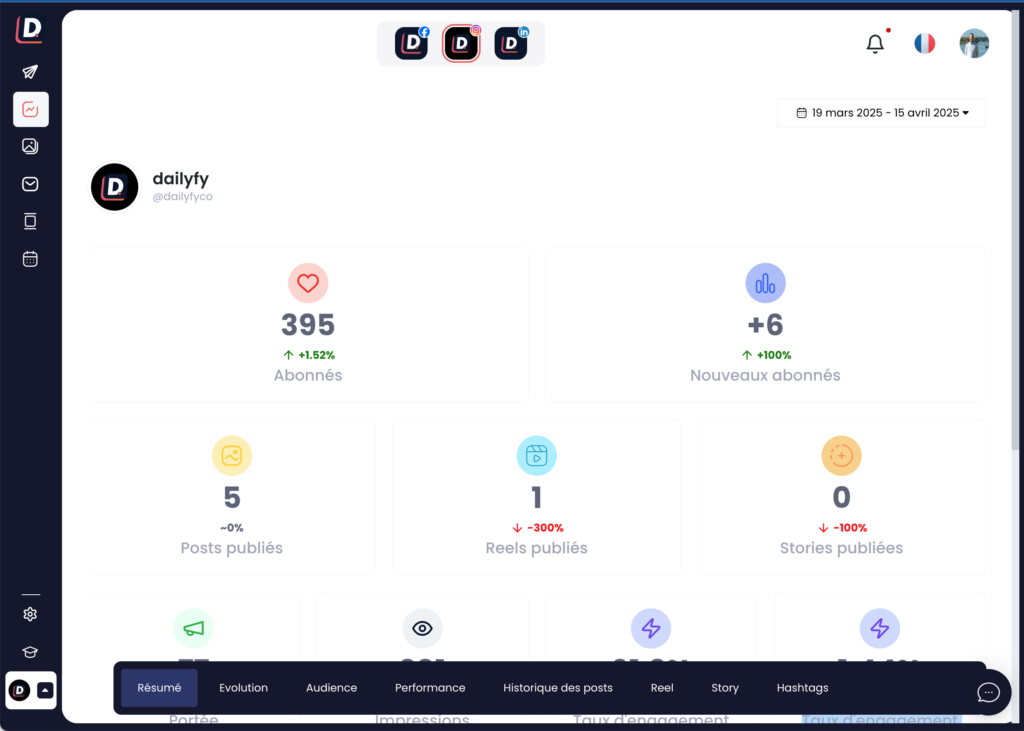
Organise reports by objective and network. Show period, volume, defined rate, relevant comparison and context. Compare similar durations; explain budget changes, collection incidents and unusual campaigns. Add an extraction date because figures may update after your first review.
Dailyfy analytics can centralise compatible measures by platform and subscription, not every native breakdown. X concerns publishing, not analytics or moderation; planned Ads features are unavailable. Keep native interfaces for verification and document scope differences instead of concealing them.
Your reporting checklist

- Each primary KPI supports an intended decision.
- Formula, period and source are visible.
- Compared rates have compatible scope.
- Missing data is not replaced with zero.
- Summed reach is not described as deduplicated.
- Organic and paid results remain identifiable.
- Attribution limits and costs are explicit.
- Review ends with a dated action or experiment.
Add this routine to your community manager workflow. Discuss what remains unknown, then choose one hypothesis to test. A sound KPI framework does not promise perpetual success: it establishes what you measure and why you take the next decision.