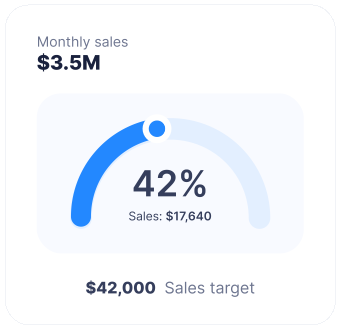
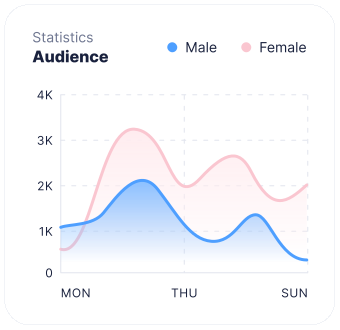
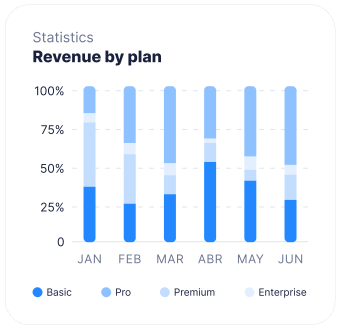
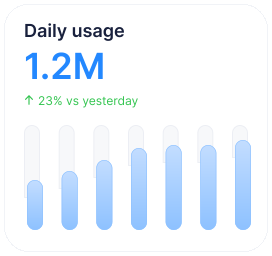
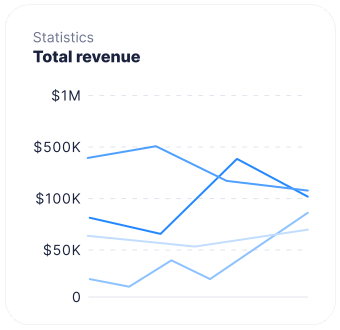
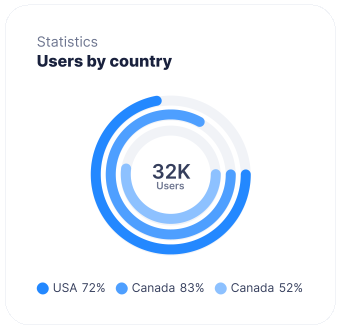
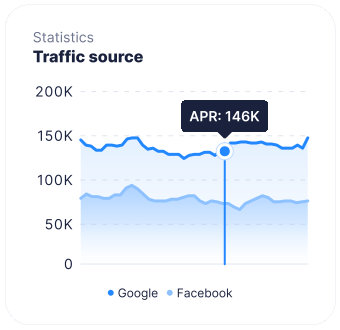
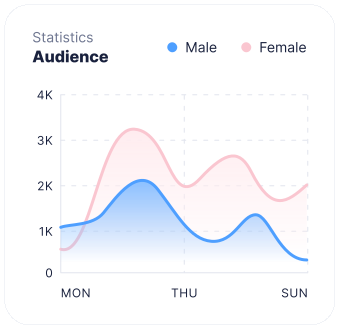
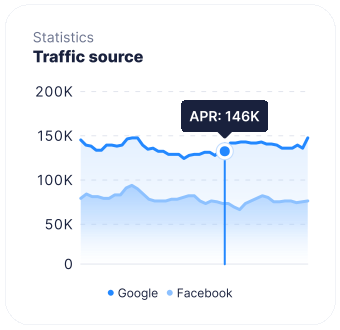
Over 100 real-time KPIs
Reach, engagement, audience, growth and performance in one always-current view.

Social statistics, KPIs and reporting in one dashboard. Track performance, compare content and decide your next action without getting lost in Excel.
14 days free, no credit card required
Reach, engagement, audience, growth and performance in one always-current view.
Find the best times from each profile’s past performance.
Compare growth, engagement and content with brands and industry benchmarks.
Build a view tailored to your priorities and track goals that truly matter to your team.
Find each platform’s useful metrics in a consistent view for the whole team.
Dailyfy makes performance clear, comparable and directly useful for your next post.
Also compare results from your content pillars : labels connect each post to its topic or campaign.
Top/Flop ranks posts by your chosen metric. See immediately which topics and formats deserve a place in your next calendar.
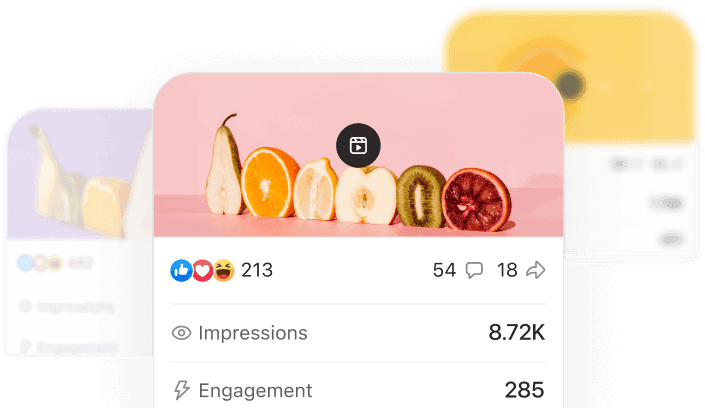
Flop 5
Isolate the lowest-performing posts for the period.
Compare their format, topic and frequency.
Avoid days and times holding results back.
Top 5
Sort and filter your best posts over any period.
Find the format generating the most engagement.
Identify days and times worth repeating.
Track growth, location, activity times and content turning audiences into a real community.
Based on past performance, get advice on format, hook, posting time and improvements before creating your next post.
MagicDaily connects reach, engagement, formats and audience changes to highlight useful signals.
Before publishing, DailyCoach compares content with past results and suggests relevant adjustments.
Test time slots, measure their impact and automatically refine times for each account.
Add competitors, compare growth, engagement and frequency, then analyze content that truly makes a difference. Explore competitor analytics.
Discover how teams, brands and creators use Dailyfy to organize their social media presence.
A very comprehensive tool for scheduling and managing social media! We appreciate collaboration, especially useful when several teams are involved.
Automating links in my posts saved me so much time, thanks to connecting my social networks in Dailyfy.
The themes are premium and the interface is polished. I migrated in one click, with no regrets: so many more possibilities.
Analyze views, watch time and retention for Facebook, TikTok and YouTube videos. Identify the second viewers leave and improve your next edit.
Select profiles, build a branded report and automate sharing with teams or clients.
Metrics precise enough for depth, clear enough for quick decisions.
Reach, engagement, community and period comparison together in a goal-focused dashboard.
Top and Flop, Stories, Reels, hashtags and lifespan reveal formats and topics to repeat.
Select profiles, period and metrics, then export useful data as CSV.
Social media analytics collects and interprets account data—reach, engagement and audience—to understand what works and adjust your content strategy.
Dailyfy brings together statistics from Dailyfy.bio, Facebook, Instagram, Threads, LinkedIn, YouTube, TikTok and Bluesky. Available metrics depend on each platform’s data.
Reach, impressions, engagement rate, community growth, video retention, Story and Reel performance, clicks and more. Choose the KPIs that matter to your business and build your dashboard.
It depends on your goal. Track reach and impressions for visibility, interactions and engagement rate for engagement, and community growth and content attracting new followers for growth.
Connect profiles and Dailyfy provides a complete performance overview: reach, engagement, growth and effective content. Identify what works and what needs changing within minutes.
Yes. Select a period and Dailyfy shows its change against the previous period to immediately identify increases and decreases.
Yes. Select business-relevant KPIs, the period, profiles and networks to create a view tailored to your goals.
Yes. Export content data as CSV to use in reports or continue analysis in another tool.
Retention depends on your plan. Analytics plans can retain history for 12 or 24 months to track trends over time.
Connect profiles, choose KPIs and turn performance into a clearer strategy.
Get started for free14 days free, no credit card required